Operational Analytics & Data Quality
GPS Reliability & Vendor Performance
Built a GPS reliability and route-performance framework to distinguish telemetry failures from operational execution issues.
Client Analytics Project · Anonymized
Problem
Vendor performance could not be evaluated without first trusting the GPS data.
GPS ping frequency, location accuracy, and device behavior varied across vendors, making raw telemetry an unreliable foundation for operational comparisons.
Analytical Question
Which trips had enough reliable evidence to evaluate?
Before calculating route or vendor performance, the analysis established whether GPS and system records were sufficiently complete to support a fair comparison.
Approach
Validate the data before evaluating the operation.
Trips were filtered for observability, GPS points were tested for multiple anomaly types, and only then was the data used for downstream performance analysis.
Trip Eligibility
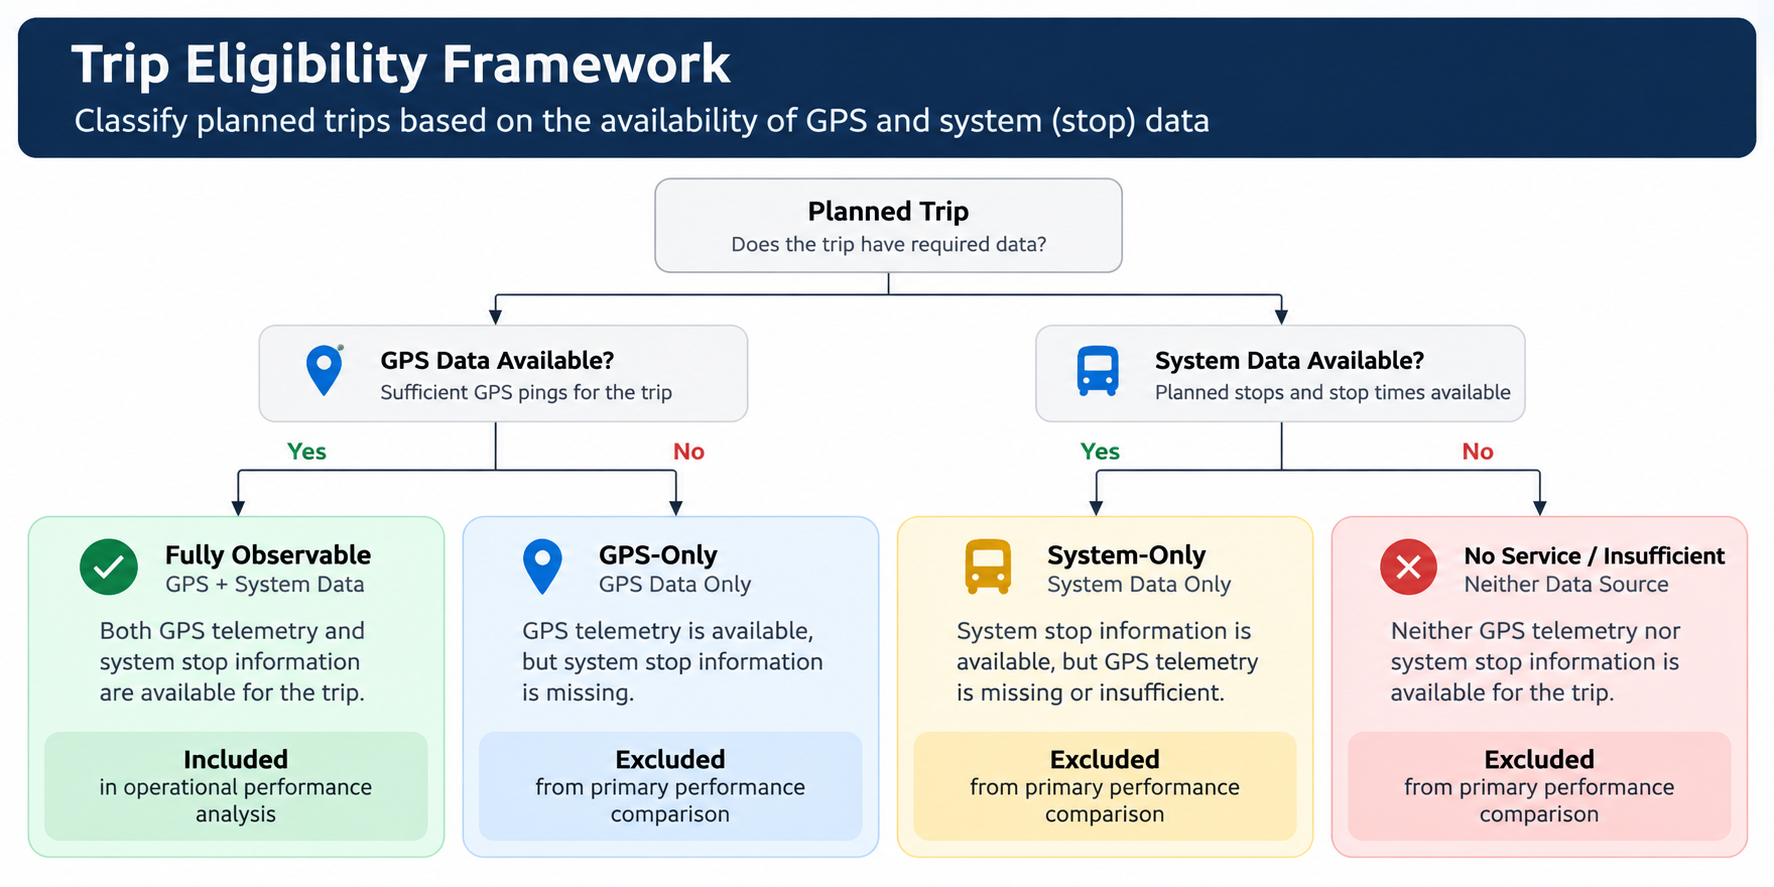
Not every planned trip should be scored.
Trips were classified according to whether GPS evidence and system stop information were available. Operational performance analysis focused on fully observable trips so vendors were not penalized when the underlying evidence was incomplete.
GPS-only, system-only, and no-service cases remained useful as data-quality signals, but were excluded from the primary performance comparison.
GPS Quality Assessment
Reliability was evaluated at the individual GPS-ping level.
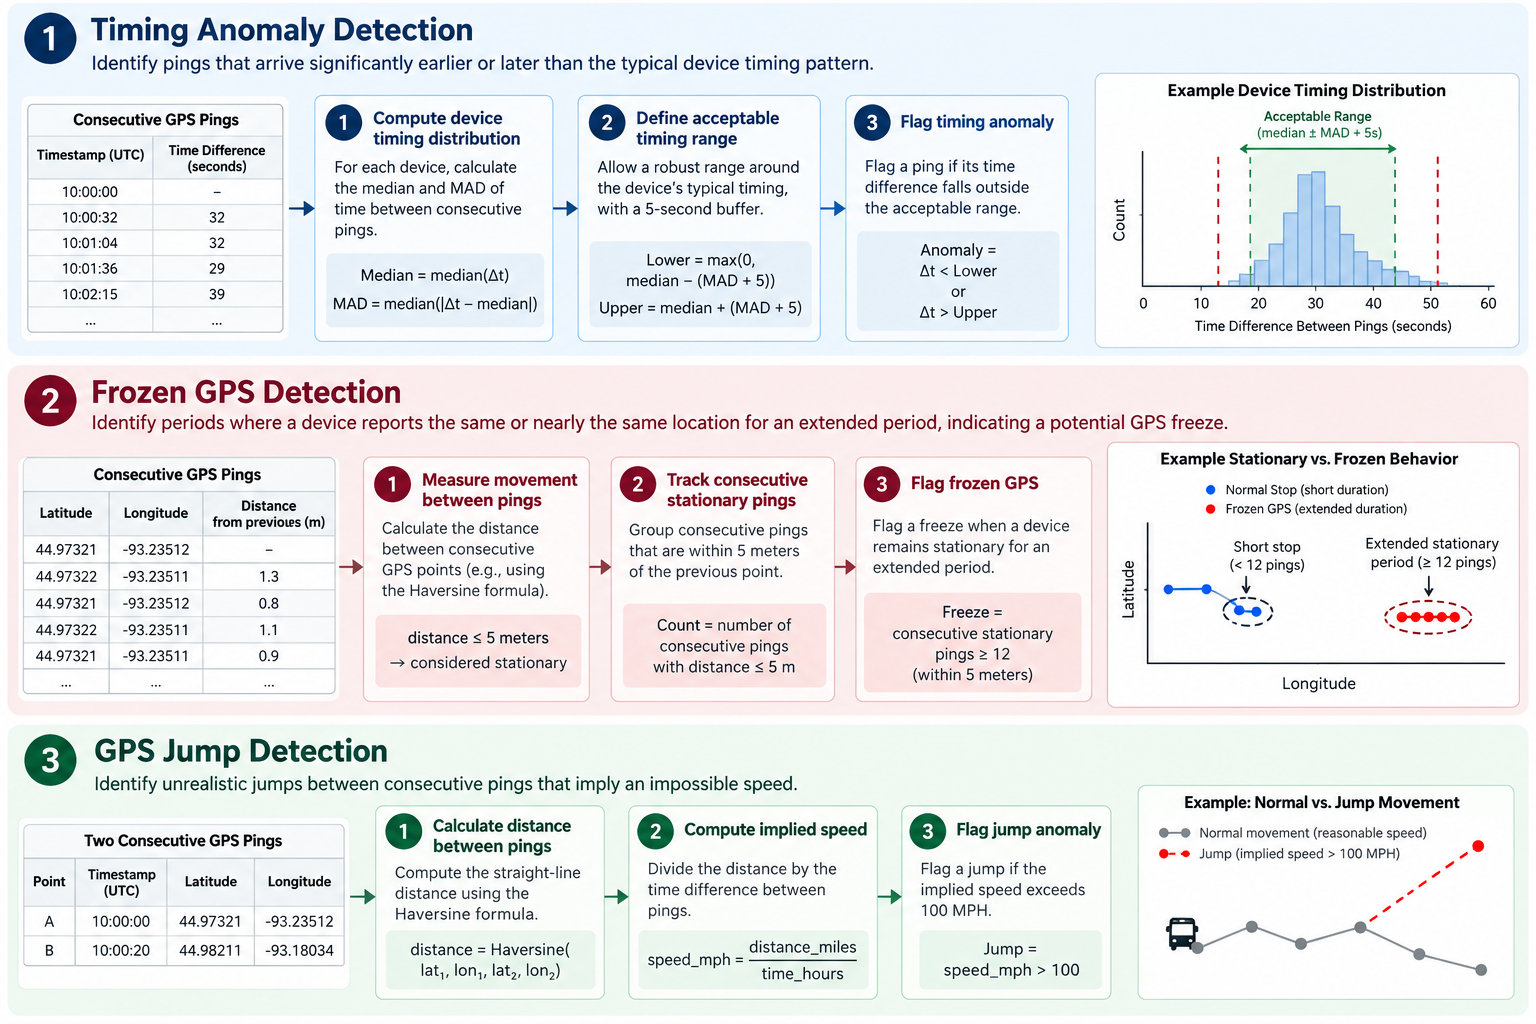
Rather than treating all unusual GPS behavior as the same problem, the analysis separated three failure modes: irregular timing, frozen locations, and unrealistic location jumps.
01
Timing Inconsistency
Detect pings that arrive substantially earlier or later than the device's normal transmission cadence.
02
Frozen GPS
Detect devices that continue sending pings while reporting nearly the same location for an unusually long period.
03
GPS Jump
Detect consecutive locations that imply physically unrealistic vehicle movement.
Technical Methodology
Each anomaly required a different decision rule.
The thresholds were designed around how GPS devices actually behave rather than applying one generic outlier rule across every failure mode.
Why vendor-specific timing?
Devices transmitted at different normal frequencies, so a single global cutoff would over-flag some vendors. Each vendor received an expected timing range based on its median interval and MAD, with an additional five-second buffer.
Why 12 stationary pings?
Repeated coordinates can occur legitimately at traffic lights or pickup and drop-off stops. Requiring a sustained sequence of near-static pings helped distinguish normal stationary behavior from a device that had stopped updating its location.
Why use implied speed?
Distance alone can be misleading when a long time gap occurs between pings. Combining Haversine distance with elapsed time allowed the analysis to flag movements implying speeds above 100 MPH instead.
GPS Reliability Score
Convert anomaly detection into one interpretable quality metric.
A GPS ping was considered anomalous if it triggered any timing, freeze, or jump condition. Reliability therefore represents the share of GPS observations that remained usable after those quality checks.
Formula
GPS Reliability = 1 −
Anomalous GPS Pings
Total GPS Pings
Operational Performance
Once the GPS data was trustworthy, we could evaluate how trips were actually executed.
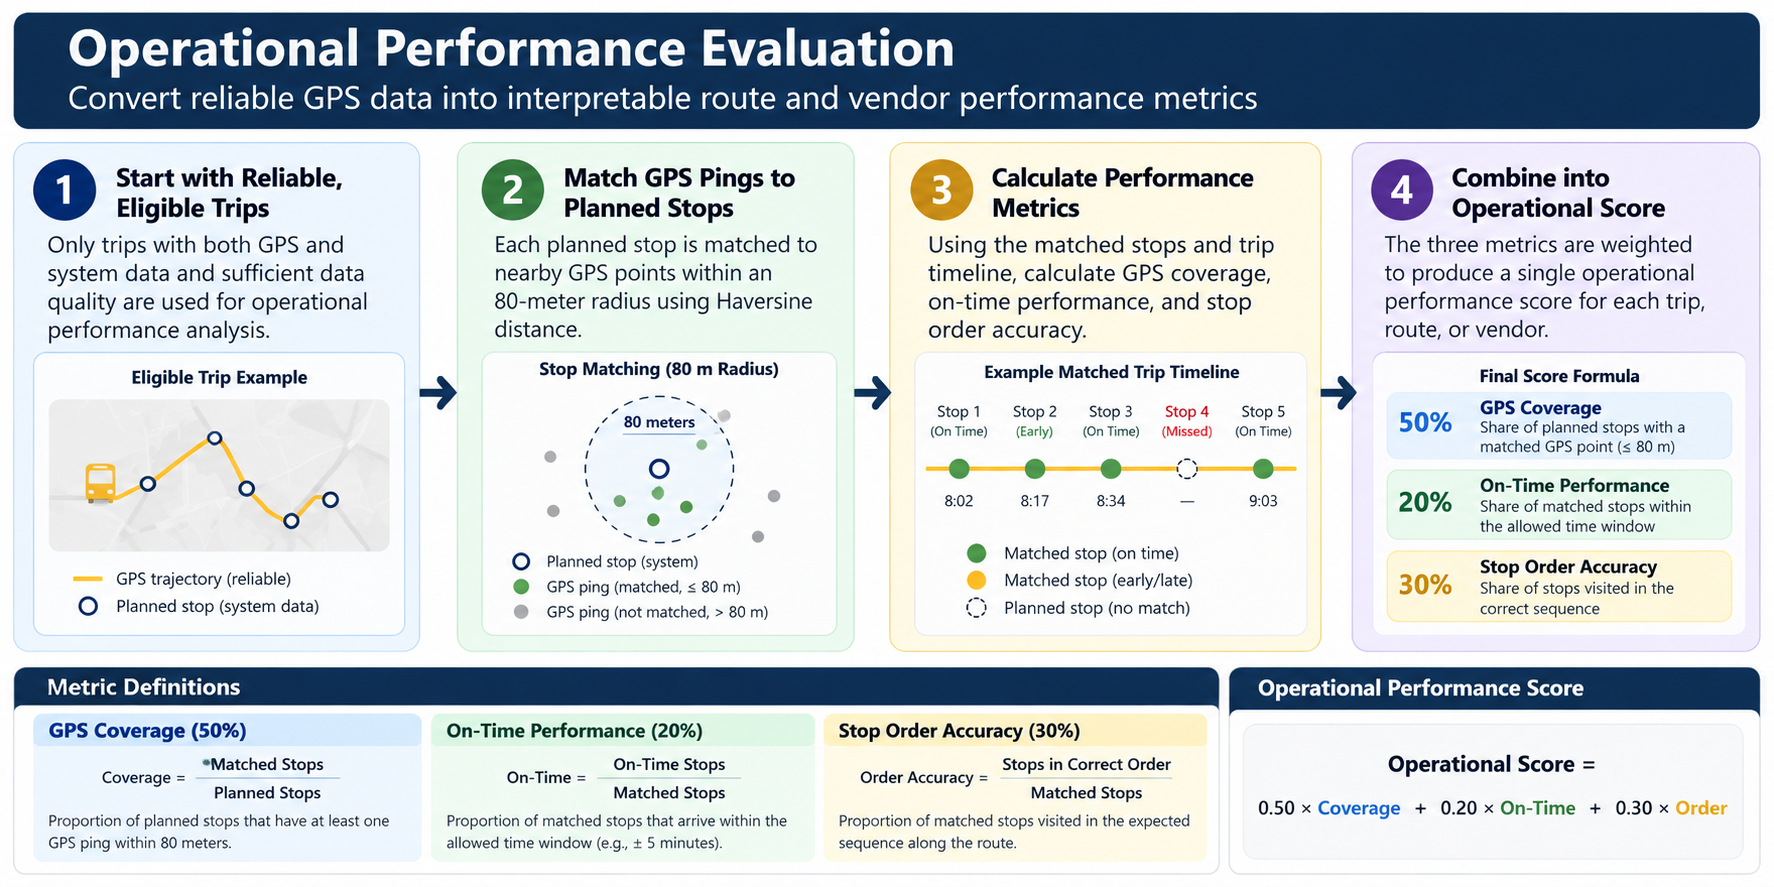
Planned stops were matched against GPS observations using an 80-meter proximity threshold. From those matched stops, we measured whether the vehicle reached the stop, arrived within the expected time window, and followed the planned stop sequence.
Business Interpretation
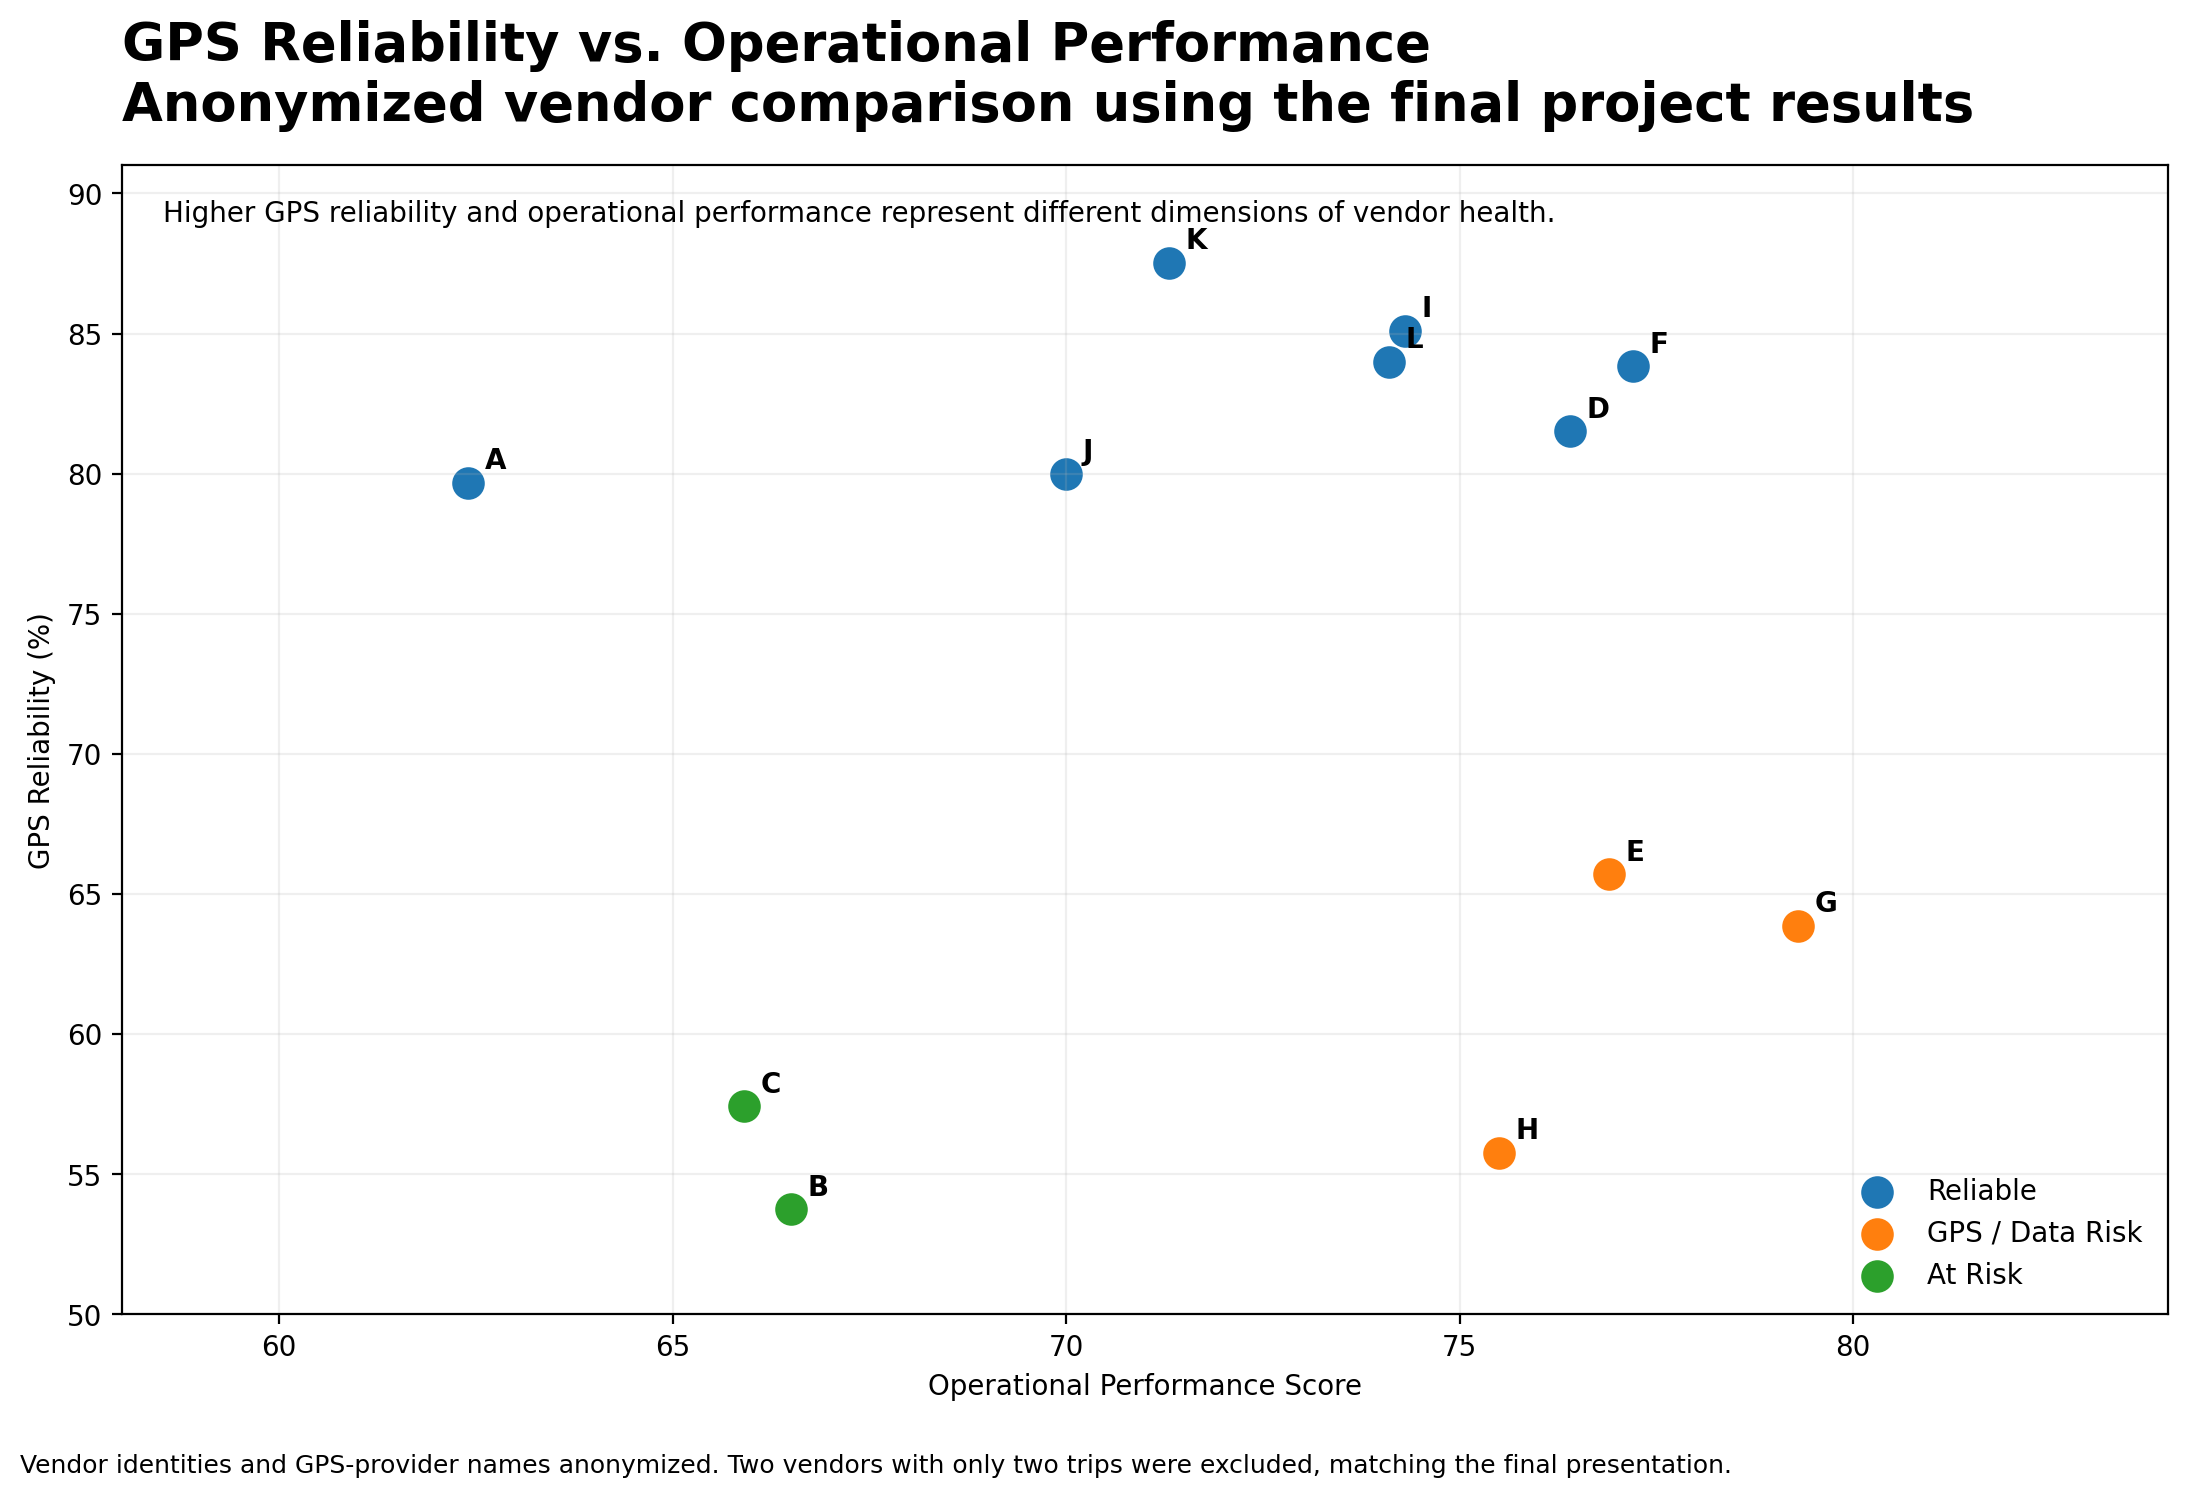
GPS reliability and operational performance are not the same problem.
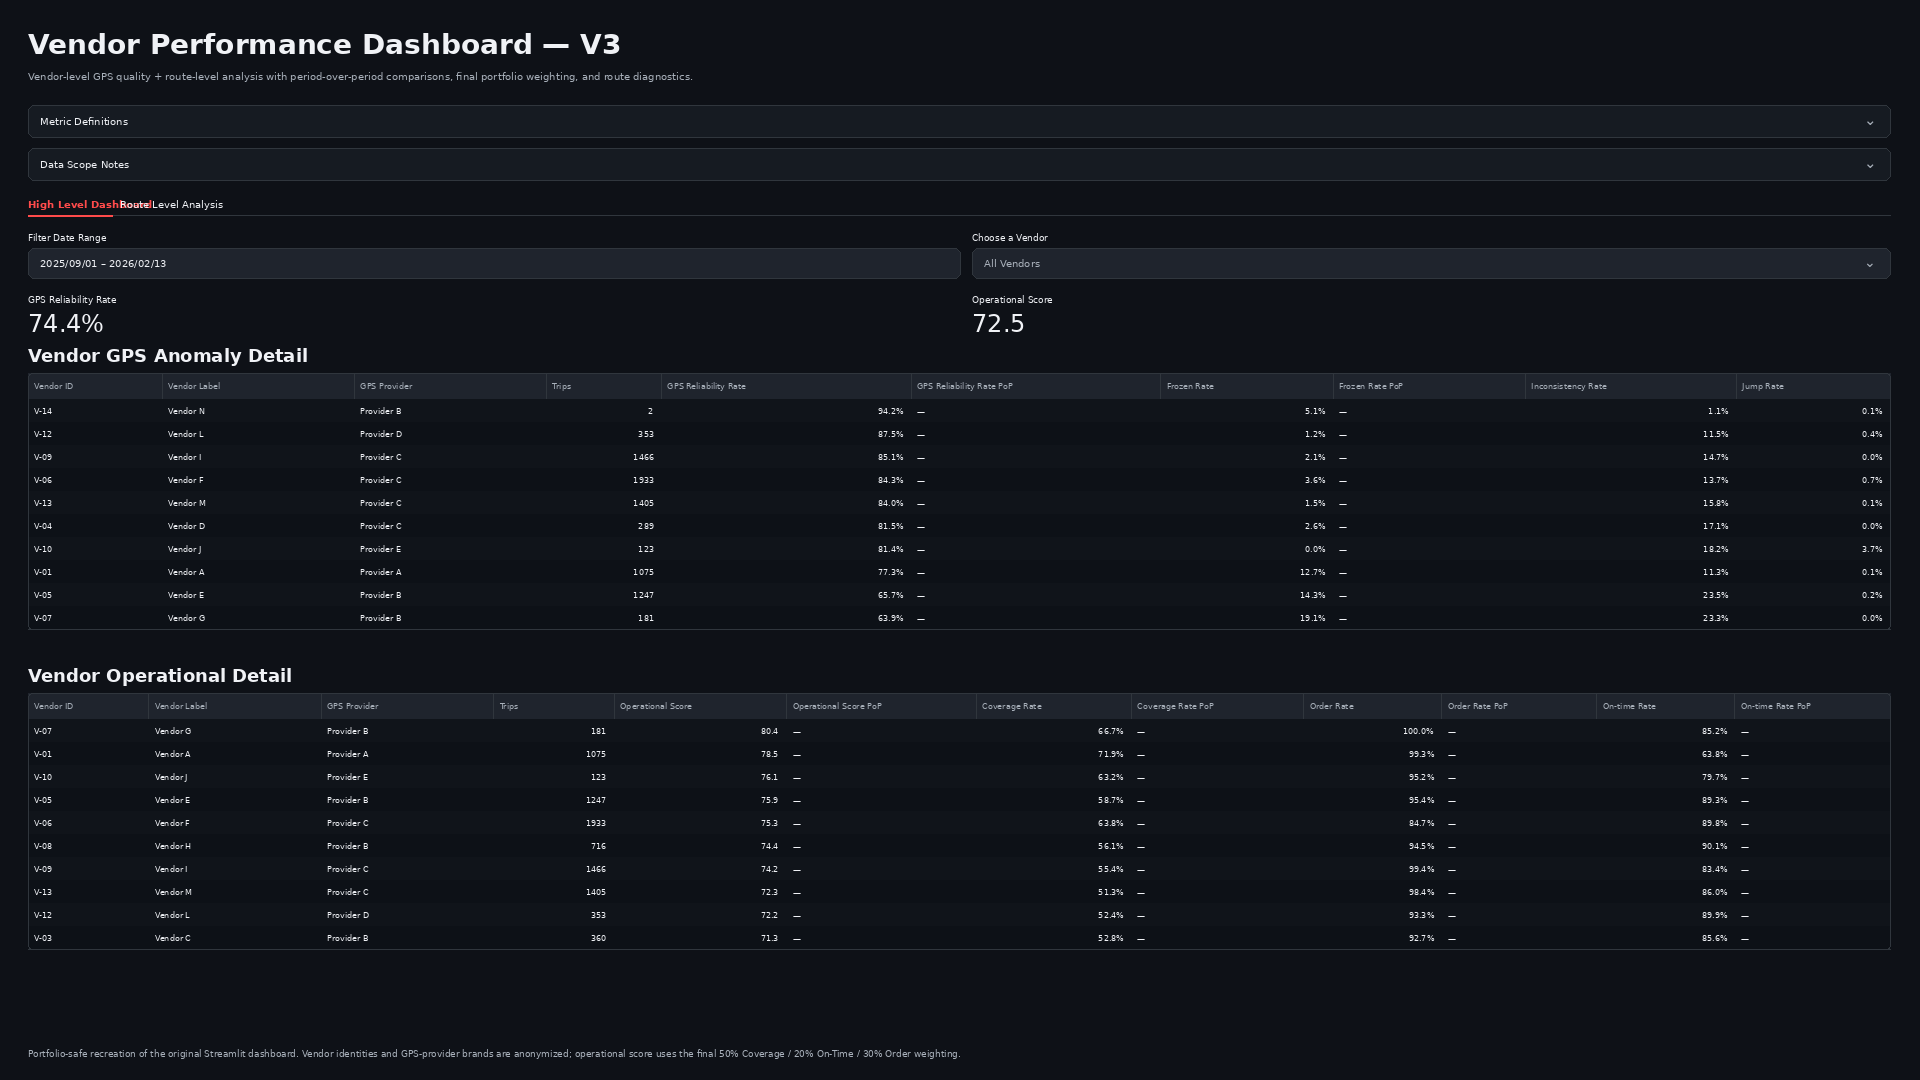
Comparing both dimensions helped separate telemetry problems from actual service-execution problems. A vendor could operate routes reasonably well while still producing unreliable GPS data, while another could have clean telemetry but weaker route performance.
Decision Support
From vendor monitoring to root-cause diagnosis.
The Streamlit dashboard turned the analytical framework into an ongoing monitoring tool. Stakeholders could identify which vendors were underperforming, compare GPS reliability with operational performance, and determine whether an issue was more likely related to telemetry quality or actual route execution.
The high-level view supported vendor comparison and performance tracking, while the route-level analysis enabled deeper investigation into missed stops, timing deviations, route-order issues, and GPS anomalies. This created a workflow that moved from identifying a problem to understanding what was driving it.
Identify
Which vendors need attention?
Compare GPS reliability and operational performance across vendors and monitor how those metrics change over time.
Diagnose
What is driving the problem?
Separate GPS-quality issues from coverage, punctuality, and route-order problems to understand whether weak performance is technical or operational.
Investigate
Where should follow-up happen?
Drill into individual routes, missed stops, anomaly behavior, and timing deviations to identify the specific source of underperformance.