Predictive Analytics & Machine Learning
Santander Customer Satisfaction Prediction
Predicting a hard-to-find dissatisfied customer segment, then translating model scores into a targeted retention strategy.
Built and evaluated predictive models across 76,020 Santander customers, compared multiple model families under severe class imbalance, and used the final risk ranking to prioritize retention activity.
Graduate Team Project · MSBA Predictive Analytics
Project Overview
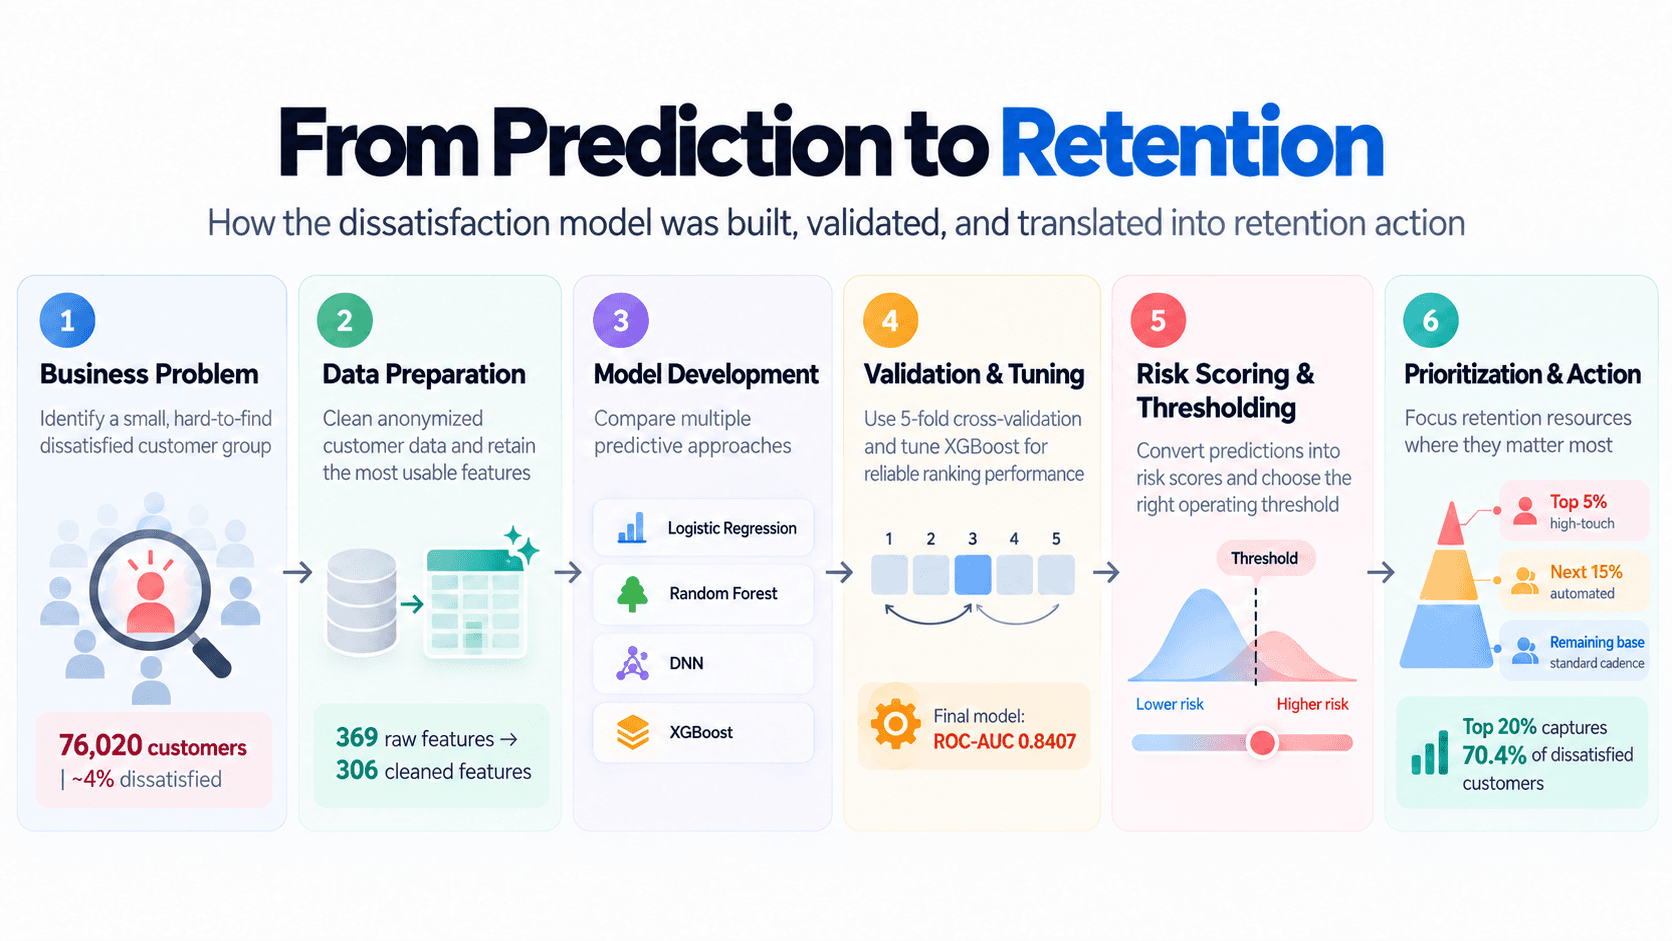
The full predictive workflow, from customer data to retention action
The project followed an end-to-end decision pipeline: define the business problem, prepare the data, compare predictive models, validate the strongest approach, convert model output into customer risk scores, and use those scores to determine where retention resources should go.
Business Problem
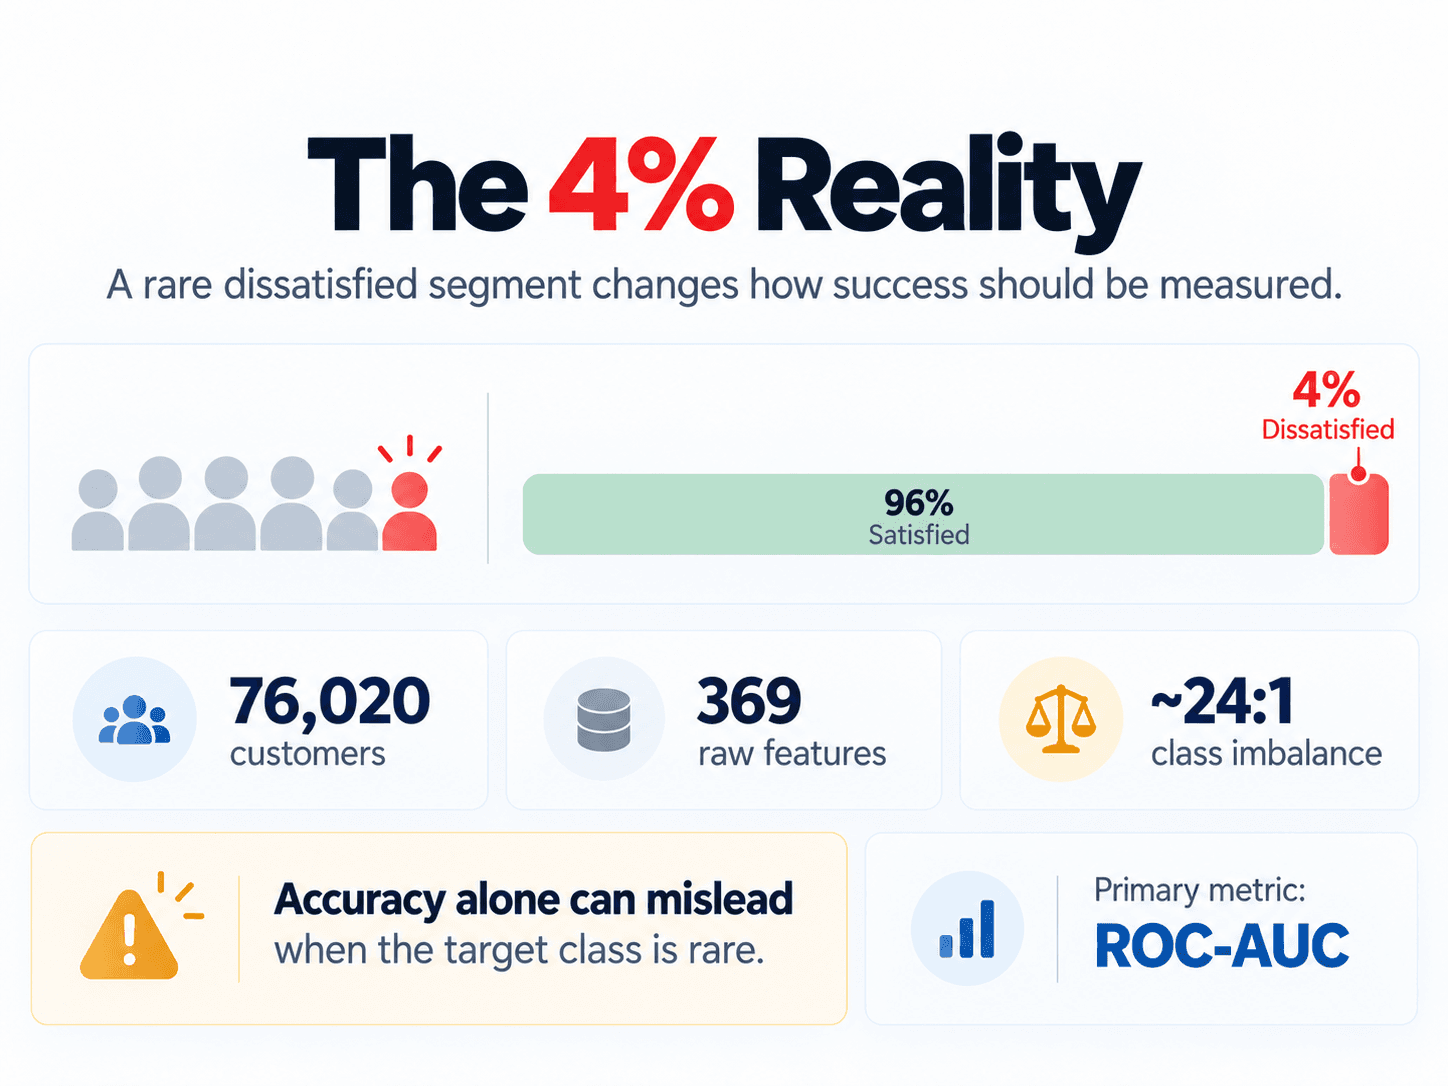
A 96/4 target changes how predictive success should be measured
Only about 4% of customers in the dataset were dissatisfied. With such a dominant majority class, raw accuracy could look strong even if the model failed to identify the customers Santander actually cared about.
The project therefore emphasized ranking quality using ROC-AUC rather than relying on accuracy alone.
Why accuracy is insufficient
Predicting the majority class correctly most of the time would not solve the retention problem.
Evaluation response
ROC-AUC measures how well the model ranks dissatisfied customers above satisfied customers across possible thresholds.
Model Development
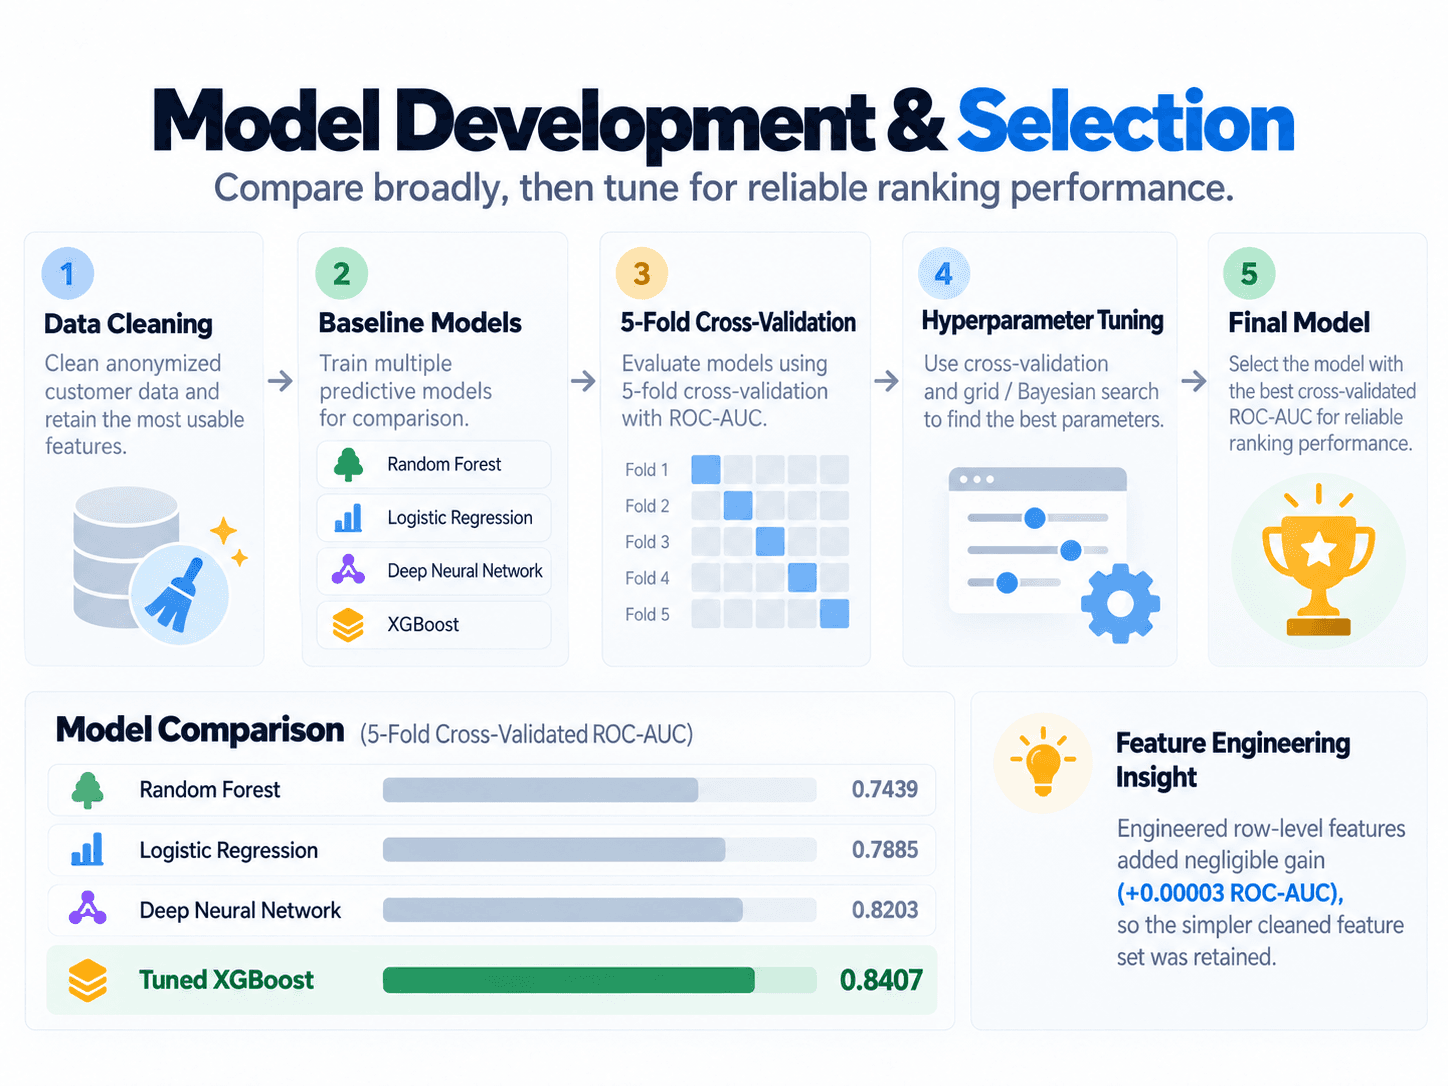
The final model was selected through comparison, validation, and tuning
The feature set was reduced from 369 to 306 usable predictors before comparing Logistic Regression, Random Forest, a Deep Neural Network, and XGBoost.
Five-fold cross-validation and hyperparameter tuning were then used to evaluate how reliably each approach ranked dissatisfied customers.
Data preparation
369 → 306
Constant and duplicate columns removed.
Modeling judgment
+0.00003
Engineered features added negligible predictive value.
Final ROC-AUC
0.8407
Tuned five-fold XGBoost ensemble.
Threshold Decision
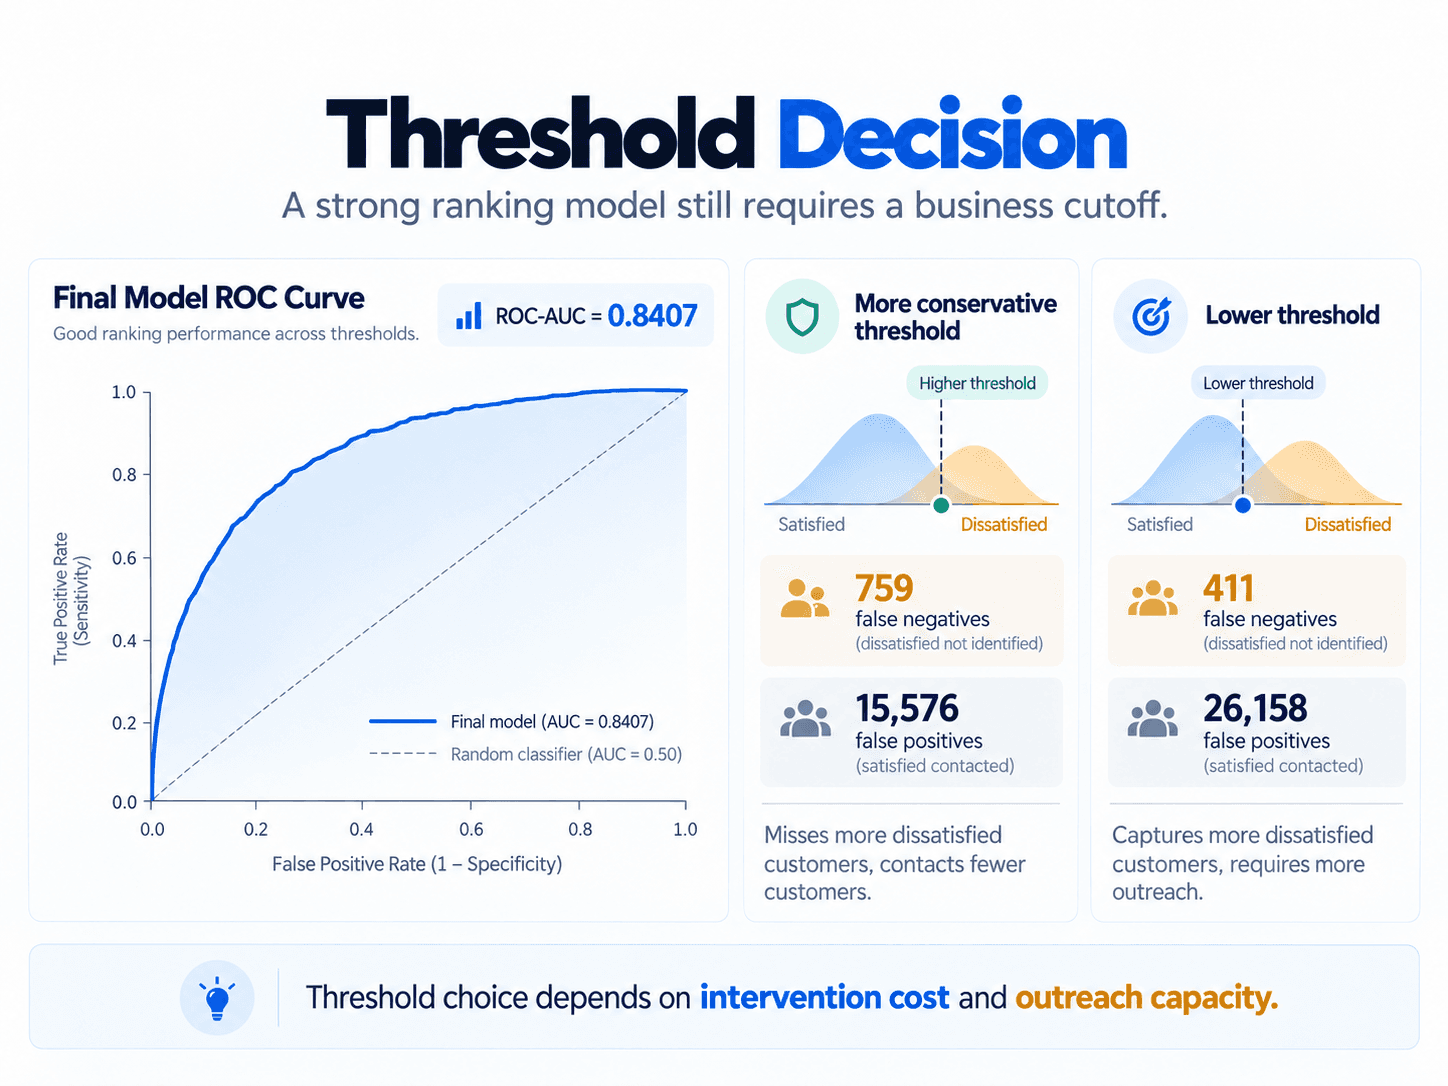
A strong ranking model still needs a business operating point
ROC-AUC evaluates performance across thresholds, but Santander still has to decide where to draw the line for intervention.
Lowering the threshold captures more dissatisfied customers, but it also means contacting more satisfied customers.
Business interpretation
If outreach is relatively inexpensive, Santander can accept more false positives in exchange for missing fewer dissatisfied customers.
Threshold selection is an operating decision layered on top of the model.
Predictive Signals
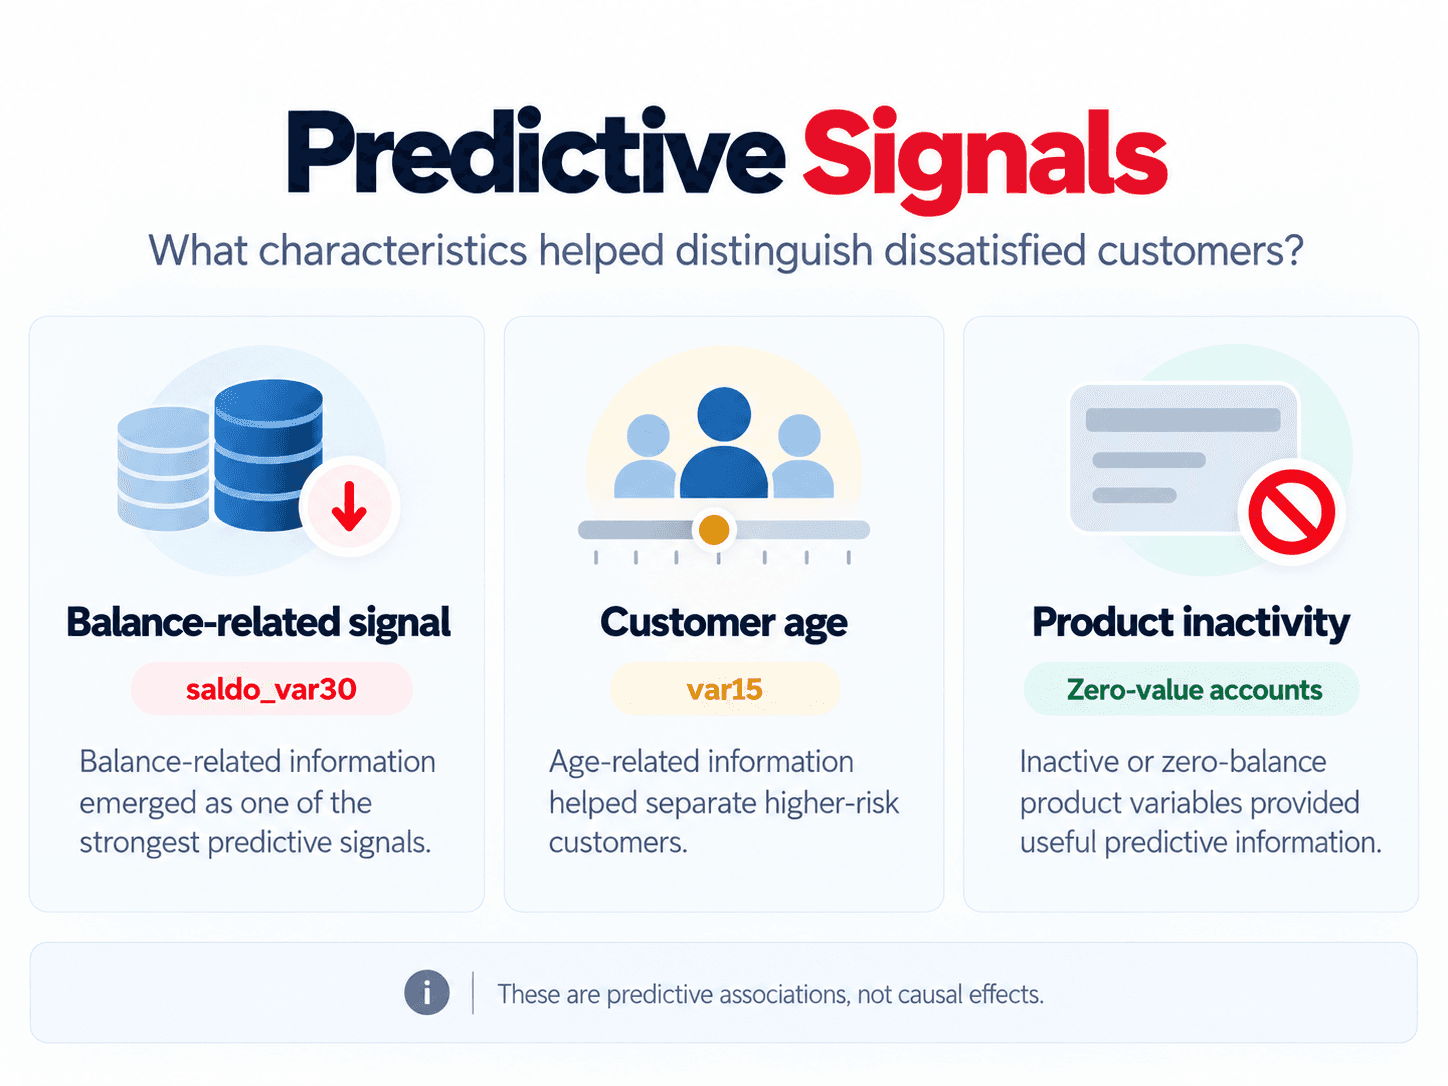
The model surfaced characteristics associated with elevated dissatisfaction risk
Model interpretation highlighted balance-related information, the anonymized age-related variable var15, and inactive or zero-value product signals as useful predictors.
Balance-related signal
saldo_var30
Age-related signal
var15
Product engagement
Zero-value and inactive accounts
Interpretation boundary
These variables are useful predictive associations. They do not establish why a customer became dissatisfied or prove a causal relationship.
Prioritization & Action
Risk ranking turns model output into a retention resource strategy
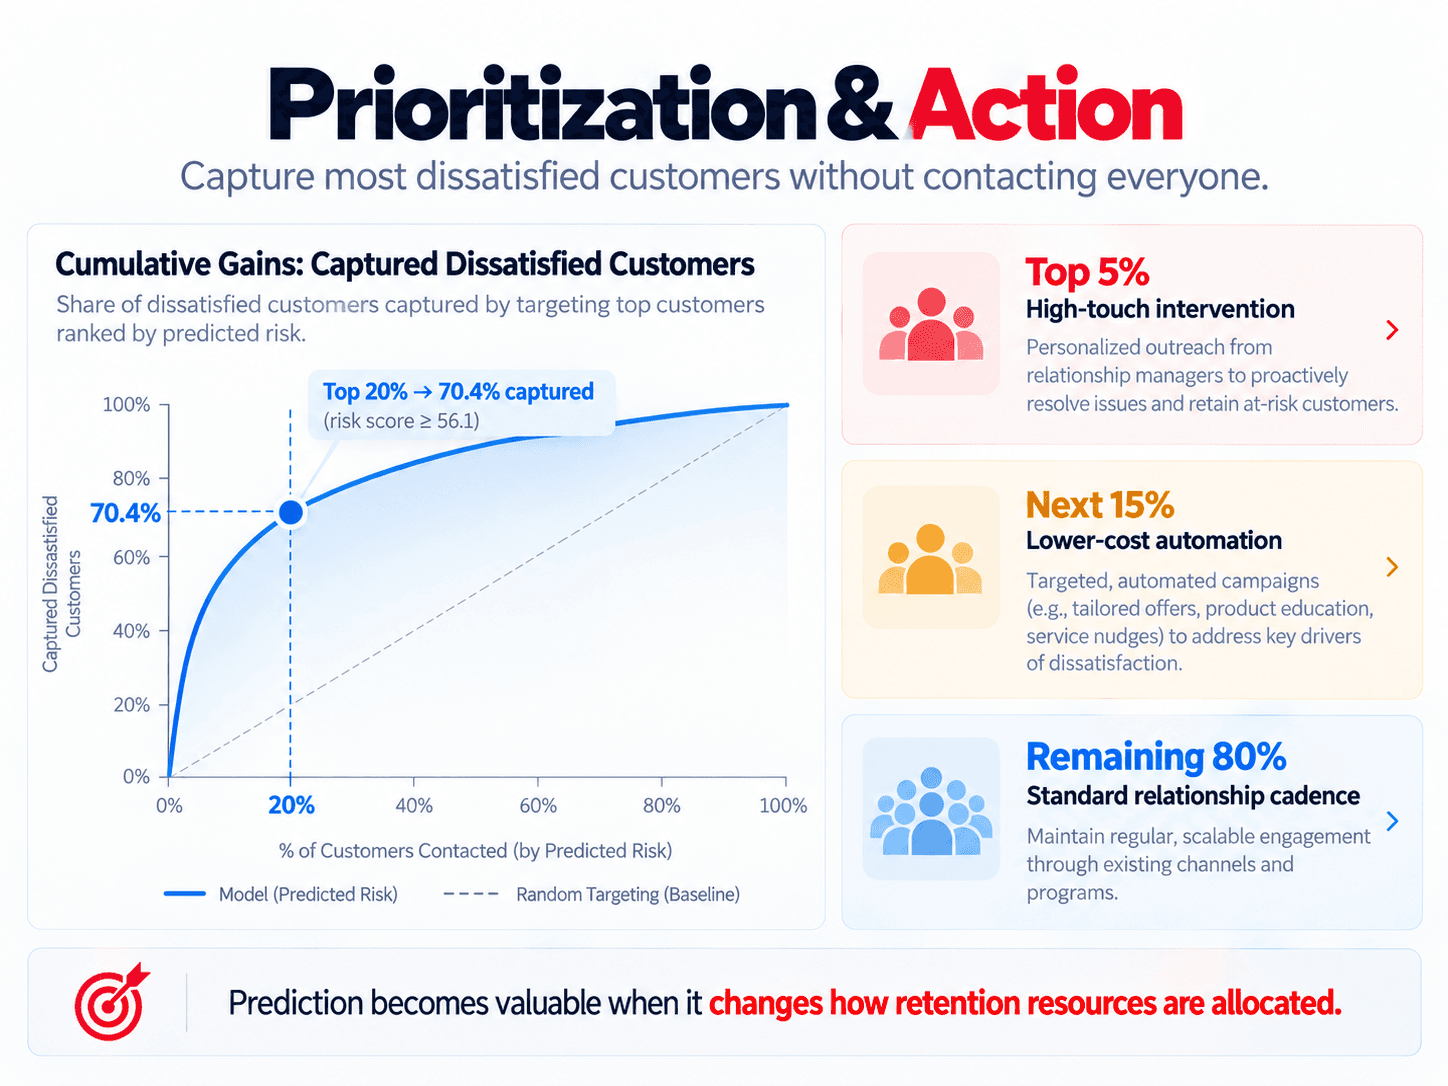
The most important business result came from ranking customers, rather than treating the model as a simple yes-or-no classifier.
Prioritization value
20%
of customers
captured 70.4% of dissatisfied customers.
What the model enables
Match intervention cost to predicted risk
High-touch outreach can be reserved for the highest-risk customers, while lower-cost automated communication can serve the next tier.
Next analytical step
Test which interventions actually improve outcomes
Prediction identifies who should be prioritized. A follow-up experiment would determine which retention actions actually improve satisfaction or retention.
Project Takeaway
Predictive analytics is most valuable when the output changes a decision.
This project moved from identifying a rare dissatisfied population to ranking customers by risk, validating how effectively that ranking concentrated dissatisfied customers, and translating those scores into a tiered retention strategy for limited business resources.