Causal Analytics & Experimentation
Star Digital Advertising Experiment
Evaluating whether digital advertising caused more subscription purchases, diagnosing weaknesses in the experiment, and turning an inconclusive treatment result into a stronger testing strategy.
Analyzed Star Digital's randomized advertising experiment using logistic regression, experimental diagnostics, interaction effects, impression frequency, and channel-level analysis to separate what the experiment could support from what required further testing.
Graduate Causal Analytics Project
Primary Effect
p = 0.0614
Inconclusive at the conventional 5% significance level.
Frequency Model
p = 0.883
Treatment assignment was not significant after accounting for impression frequency.
Channel Interaction
p = 0.0476
Treatment interacted more strongly with the Sites 1–5 network.
Project Overview
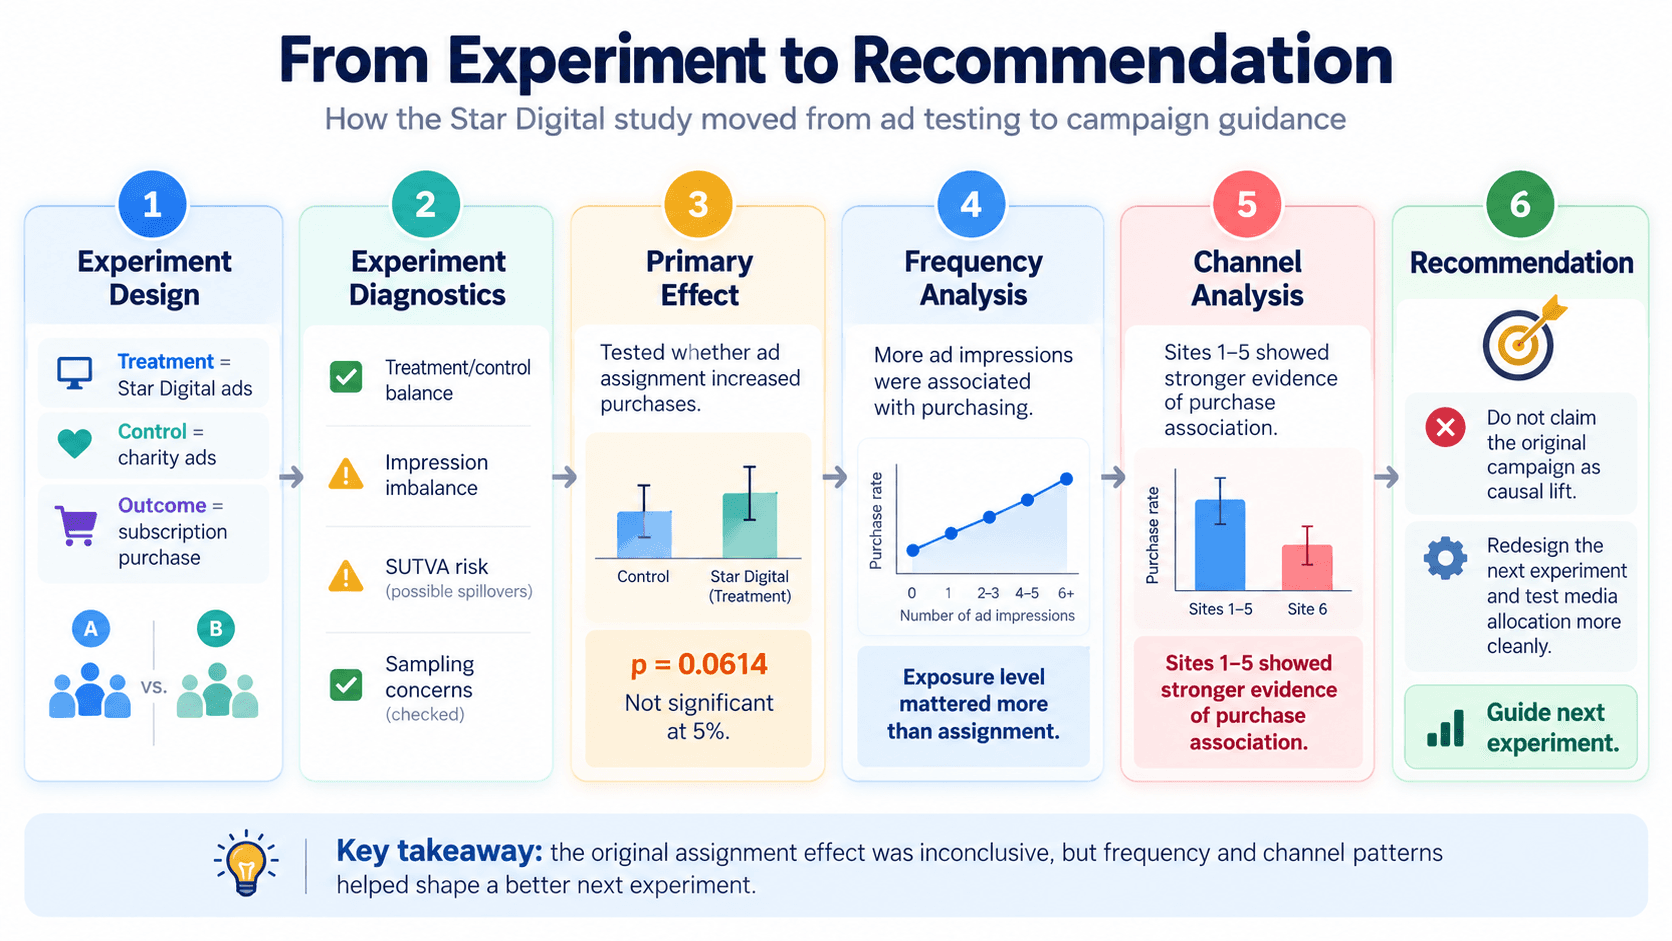
From experiment design to a better next test
The analysis began with a straightforward causal question: whether showing Star Digital ads increased subscription purchases. When the primary result proved inconclusive, the project moved deeper into experimental validity, exposure frequency, and channel behavior before translating those findings into recommendations for a cleaner follow-up experiment.
Experiment Design
Can Star Digital ads cause more subscription purchases?
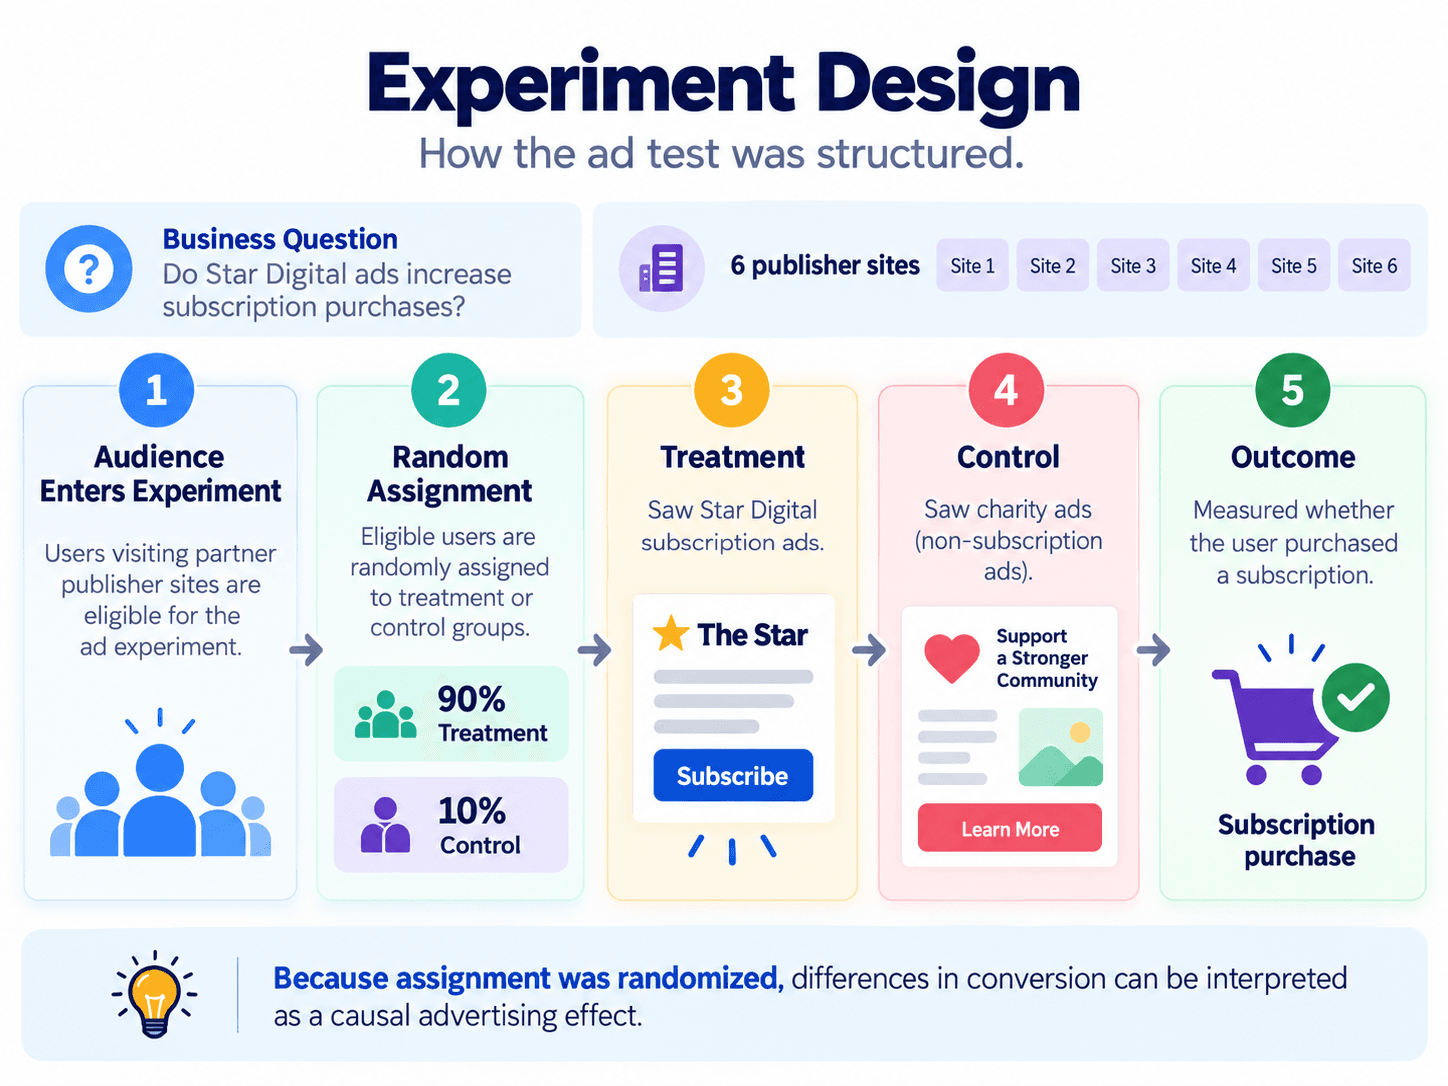
Users were assigned to a treatment group that saw Star Digital advertisements or a control group that saw charity advertisements. Exposure could occur across six publisher sites, and the primary outcome was whether the user purchased a Star Digital subscription.
Because treatment assignment was randomized, the experiment was designed to estimate an incremental advertising effect rather than a simple correlation between ad exposure and purchasing.
Treatment
Star Digital advertisements
Control
Charity advertisements
Outcome
Subscription purchase
Experiment Diagnostics
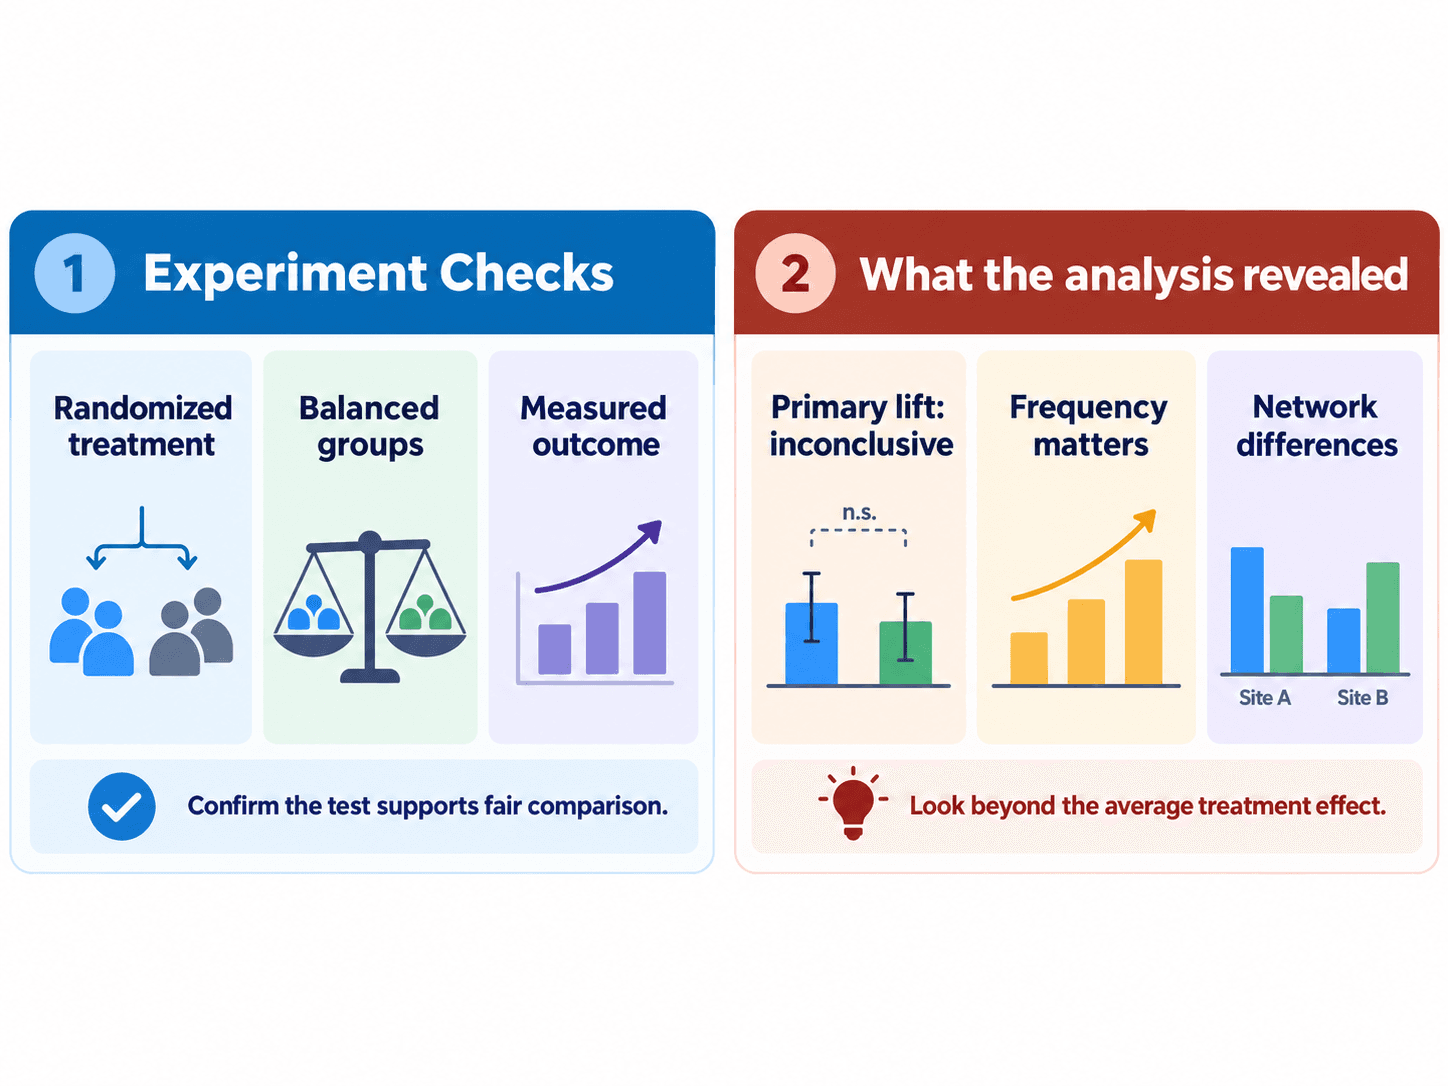
A randomized experiment still needs validity checks
Before interpreting the treatment effect, the experiment was evaluated for design issues that could complicate a causal conclusion.
Possible SUTVA violation
Spillovers between treatment and control users, such as users discussing ads or sharing devices, could violate the assumption that one user's treatment does not affect another user's outcome.
Impression imbalance
Sites 1, 3, and 5 showed statistically significant differences in the number of impressions received by the treatment and control groups. Sites 2, 4, and 6 did not.
Choice-based sampling
The experimental sample was approximately 50/50 purchasers and non-purchasers, while Star Digital reported a true purchase rate of 15%. This limits how directly estimated probabilities and magnitudes can be generalized to the real customer population.
Treatment allocation
The experiment used roughly a 90/10 treatment-control split, which can reduce statistical power relative to a more balanced allocation.
Primary Treatment Effect
The main experiment did not provide strong enough evidence of causal lift
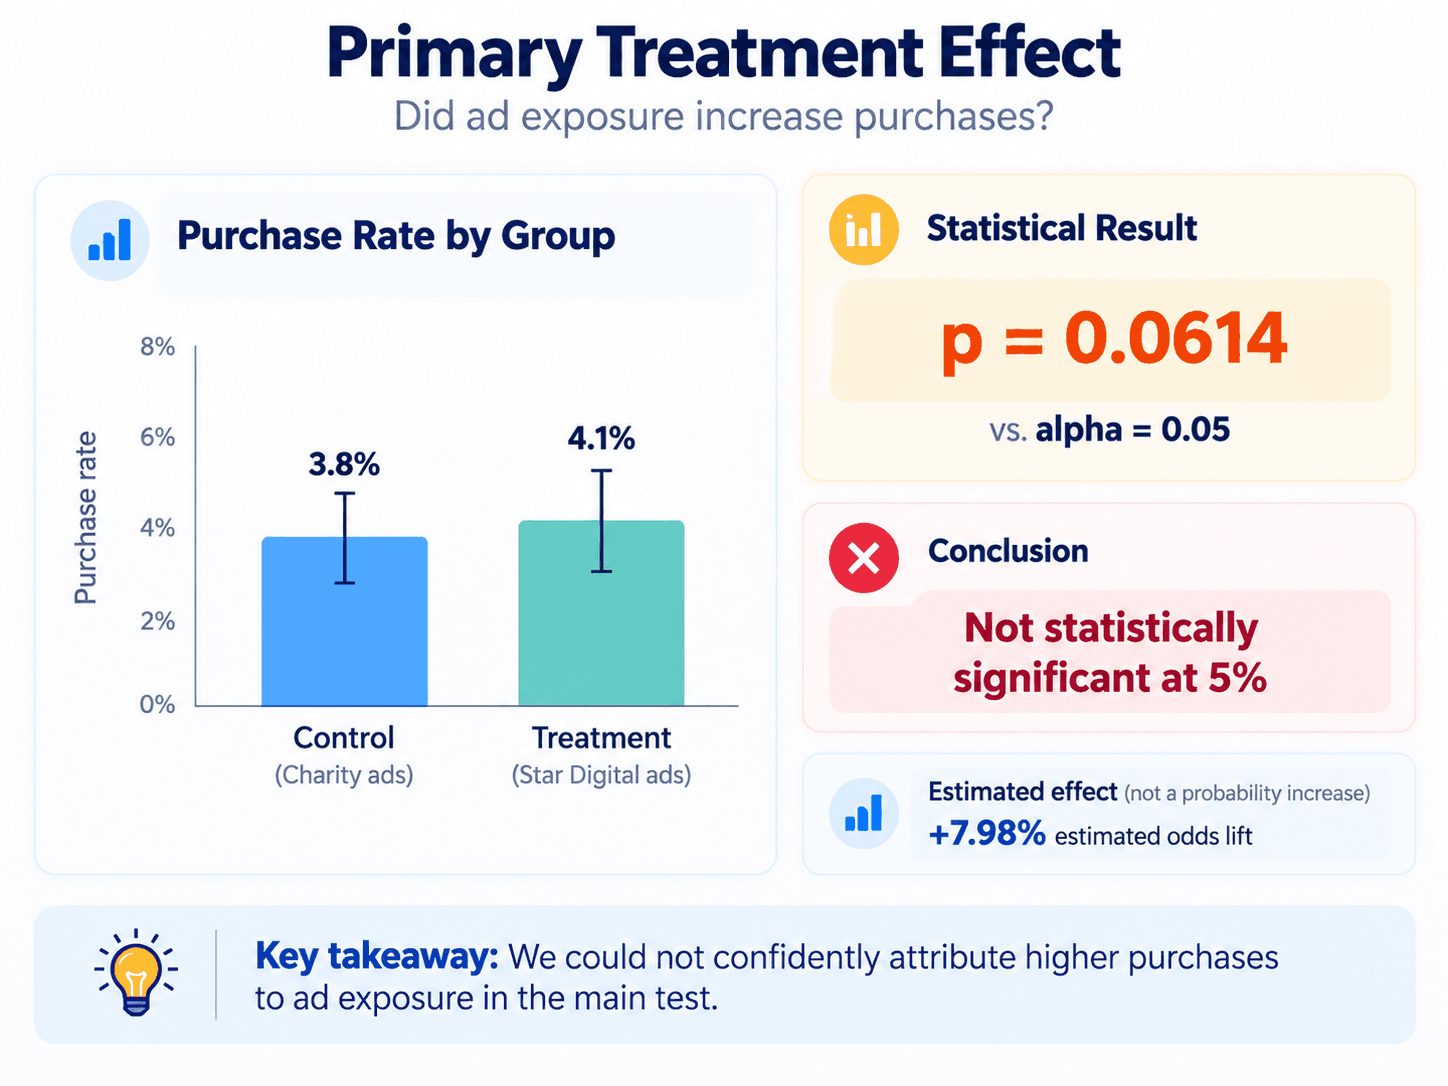
A logistic regression comparing purchase behavior between the treatment and control groups produced a p-value of 0.0614.
At the conventional 5% significance level, the result does not provide sufficient evidence to conclude that assignment to Star Digital advertising caused more subscription purchases.
Analytical decision
Do not force significance from a borderline result.
The estimated treatment coefficient corresponded to roughly a 7.98% increase in odds, but because the treatment effect was not statistically significant at 5%, that estimate should not be presented as a proven advertising impact.
Frequency Analysis
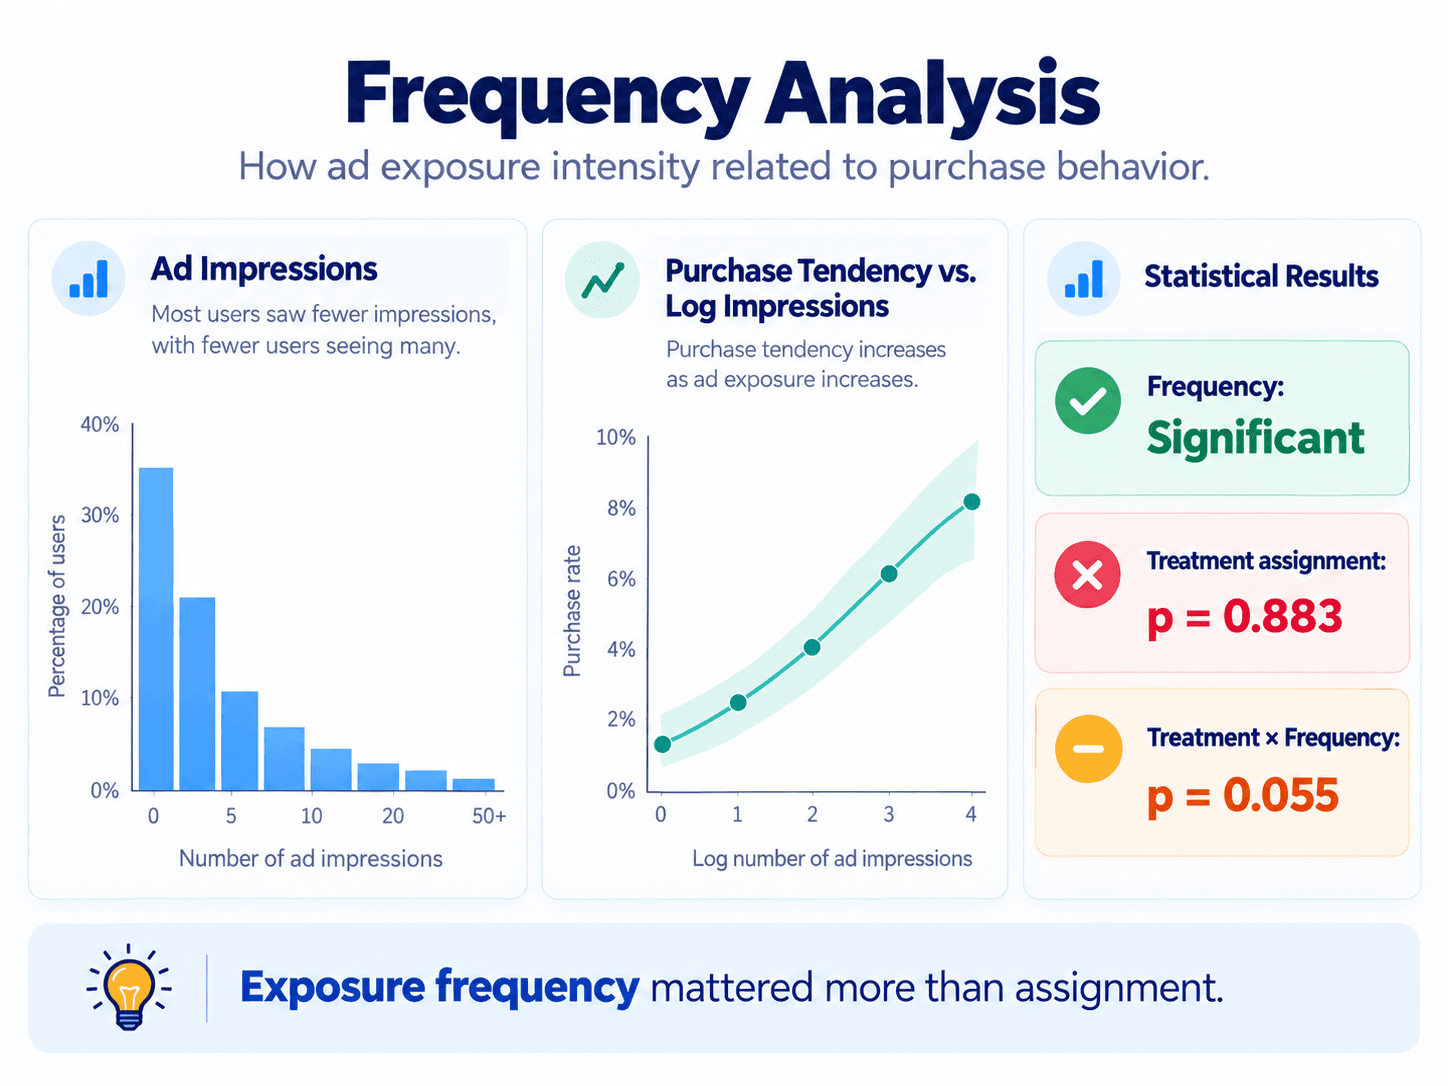
Exposure frequency was more informative than treatment assignment
The next model incorporated the total number of advertising impressions seen by each user. Because impression counts were highly skewed, the analysis used the log of total impressions rather than treating every additional exposure as an equal linear increase.
Impression frequency
Strongly associated with purchasing
Treatment assignment
p = 0.883
Once frequency was included, assignment to the Star Digital treatment itself was not statistically significant.
Treatment × frequency
p = 0.055
The interaction was close to the conventional significance threshold, but still did not provide a clean 5% result.
Interpretation boundary
Impression frequency was not itself randomized. The frequency result therefore shows a strong predictive association with purchase behavior, not clean causal evidence that simply increasing impressions will create more purchases.
Channel Analysis
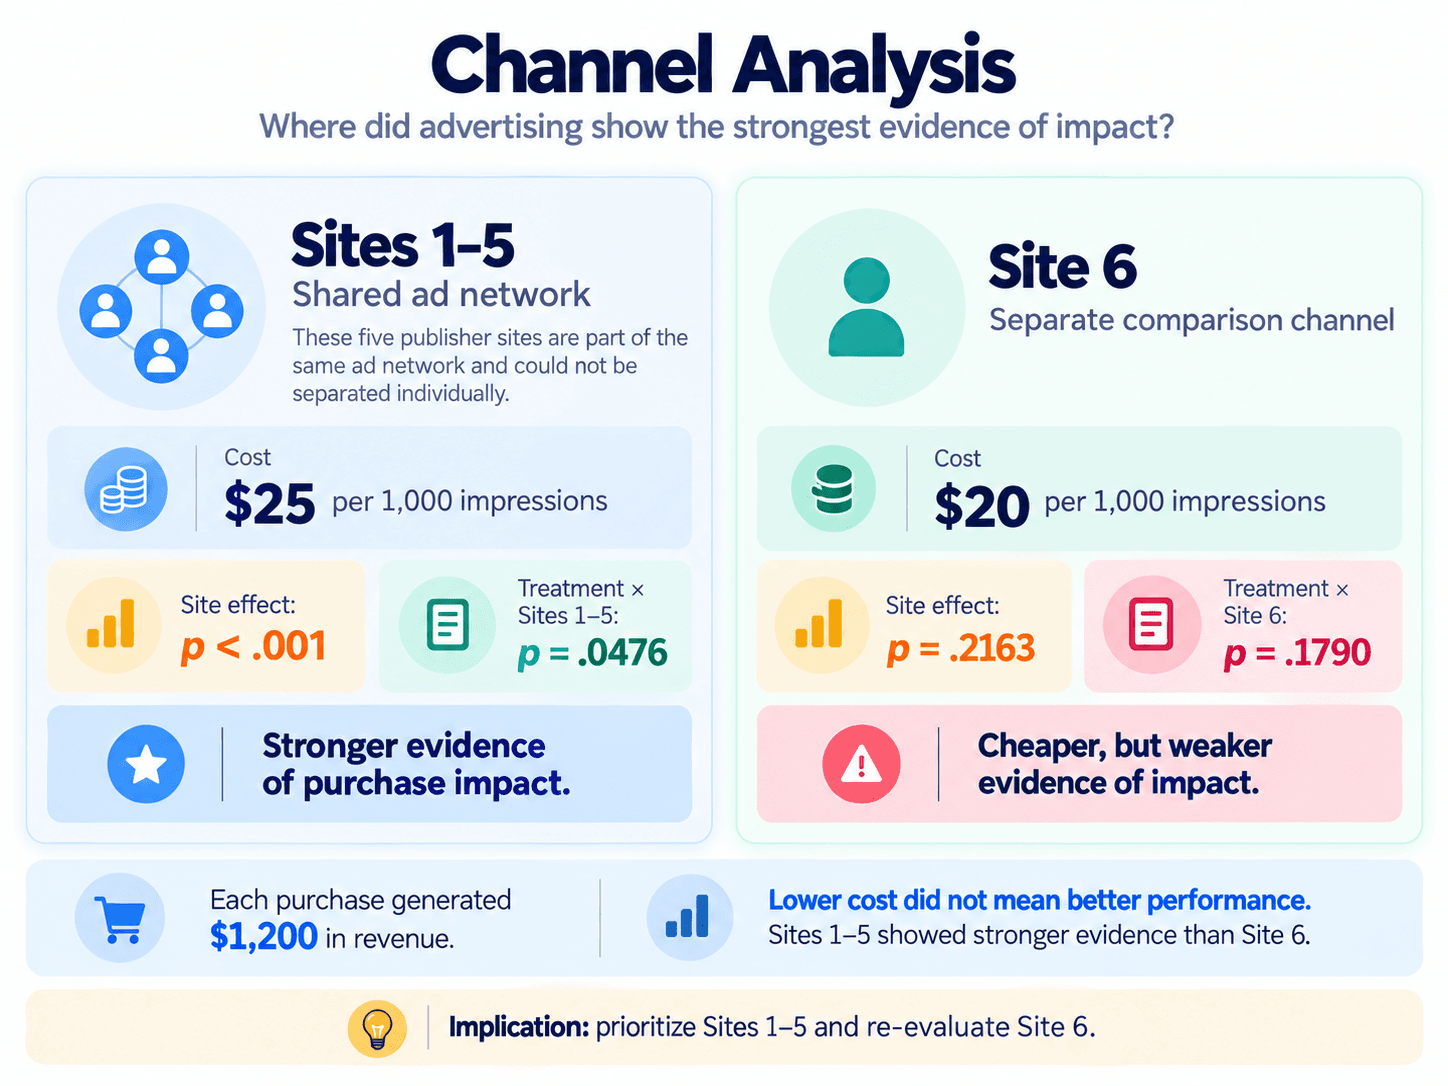
Cheaper inventory did not show stronger evidence of purchase impact
Sites 1–5 belonged to the same advertising network and therefore had to be evaluated together. Site 6 used a separate pricing structure and provided a comparison channel.
Sites 1–5
$25 CPM
Per 1,000 impressions
Site effect: p < .001
Treatment interaction: p = .0476
Site 6
$20 CPM
Per 1,000 impressions
Site effect: p = .2163
Treatment interaction: p = .1790
Although Site 6 was cheaper, the analysis showed substantially weaker evidence linking its impressions to purchases. That makes Sites 1–5 the stronger candidate for further testing, rather than proof that they causally outperform Site 6.
Recommendation & Next Experiment
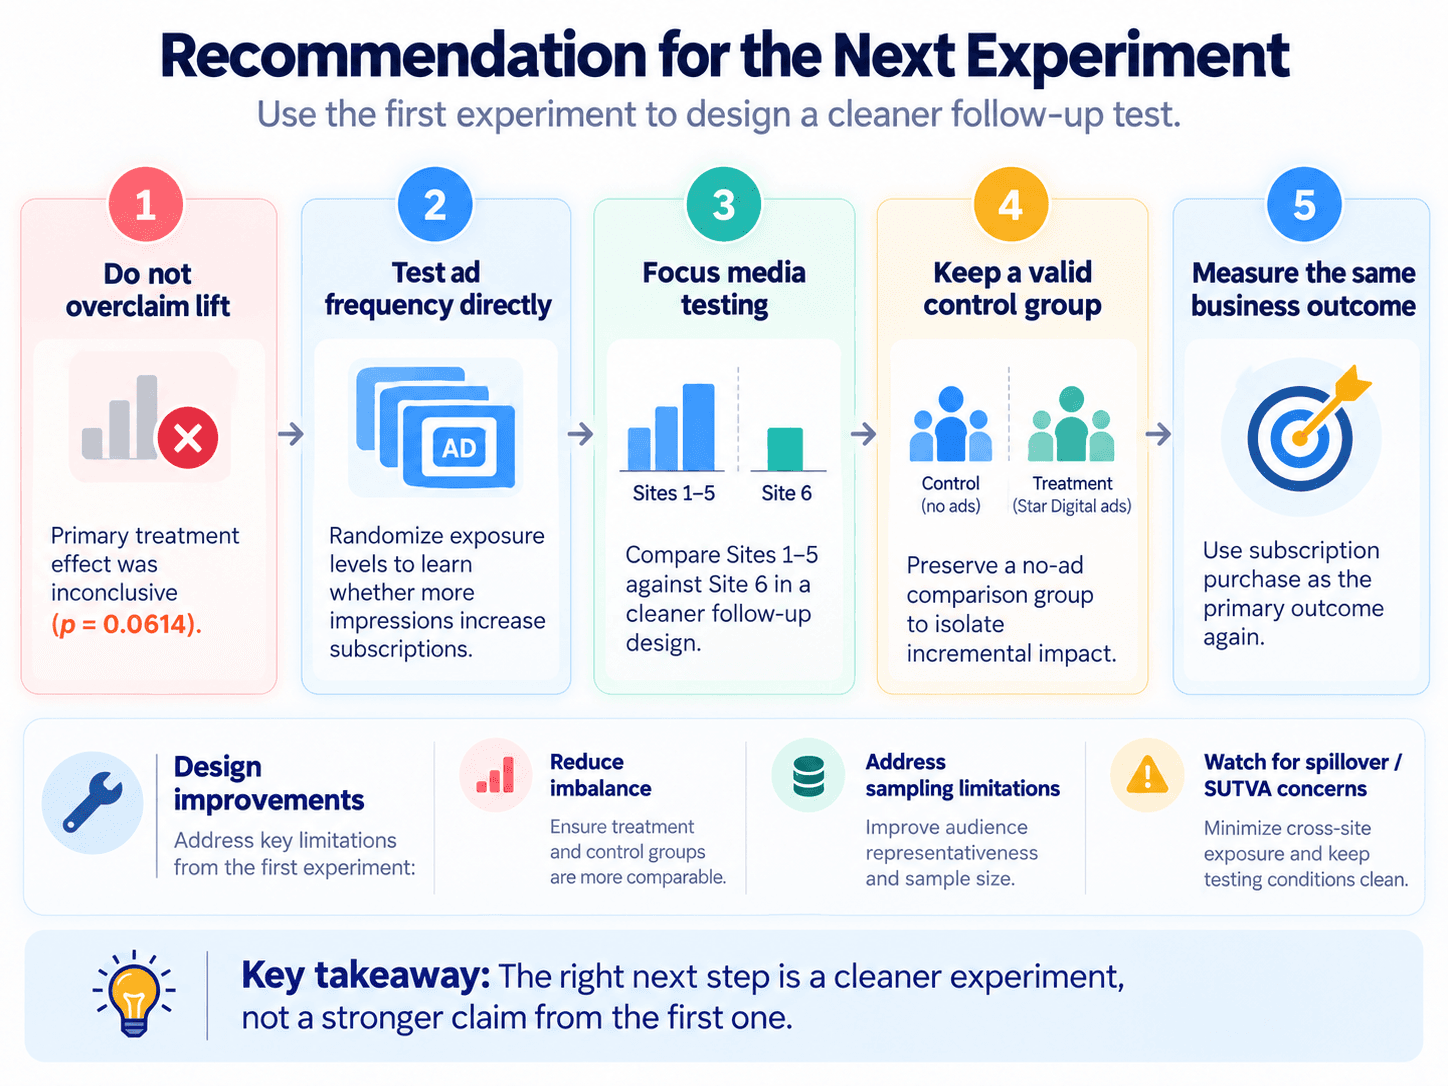
Use the first experiment to design a cleaner second one
The first experiment did not justify a confident claim that Star Digital advertising increased subscriptions. Its real value was identifying where the next experiment should become more deliberate.
Randomize exposure frequency
Directly assign users to different impression levels so the relationship between frequency and purchasing can be tested causally rather than observationally.
Compare channel allocation more cleanly
Use the stronger Sites 1–5 signal as a hypothesis for the next experiment and compare it against Site 6 or another clearly defined channel condition.
Improve experimental validity
Reduce treatment-control imbalance, improve sample representativeness, and minimize spillover or other SUTVA concerns before interpreting incremental advertising lift.
Project Takeaway
An inconclusive experiment can still produce a valuable analytical decision.
The strongest conclusion was not that Star Digital advertising definitively caused more subscriptions. It was recognizing the limits of the primary treatment effect, identifying meaningful frequency and channel patterns, and using those findings to design a more targeted and credible follow-up experiment.